Sea Level Explainer
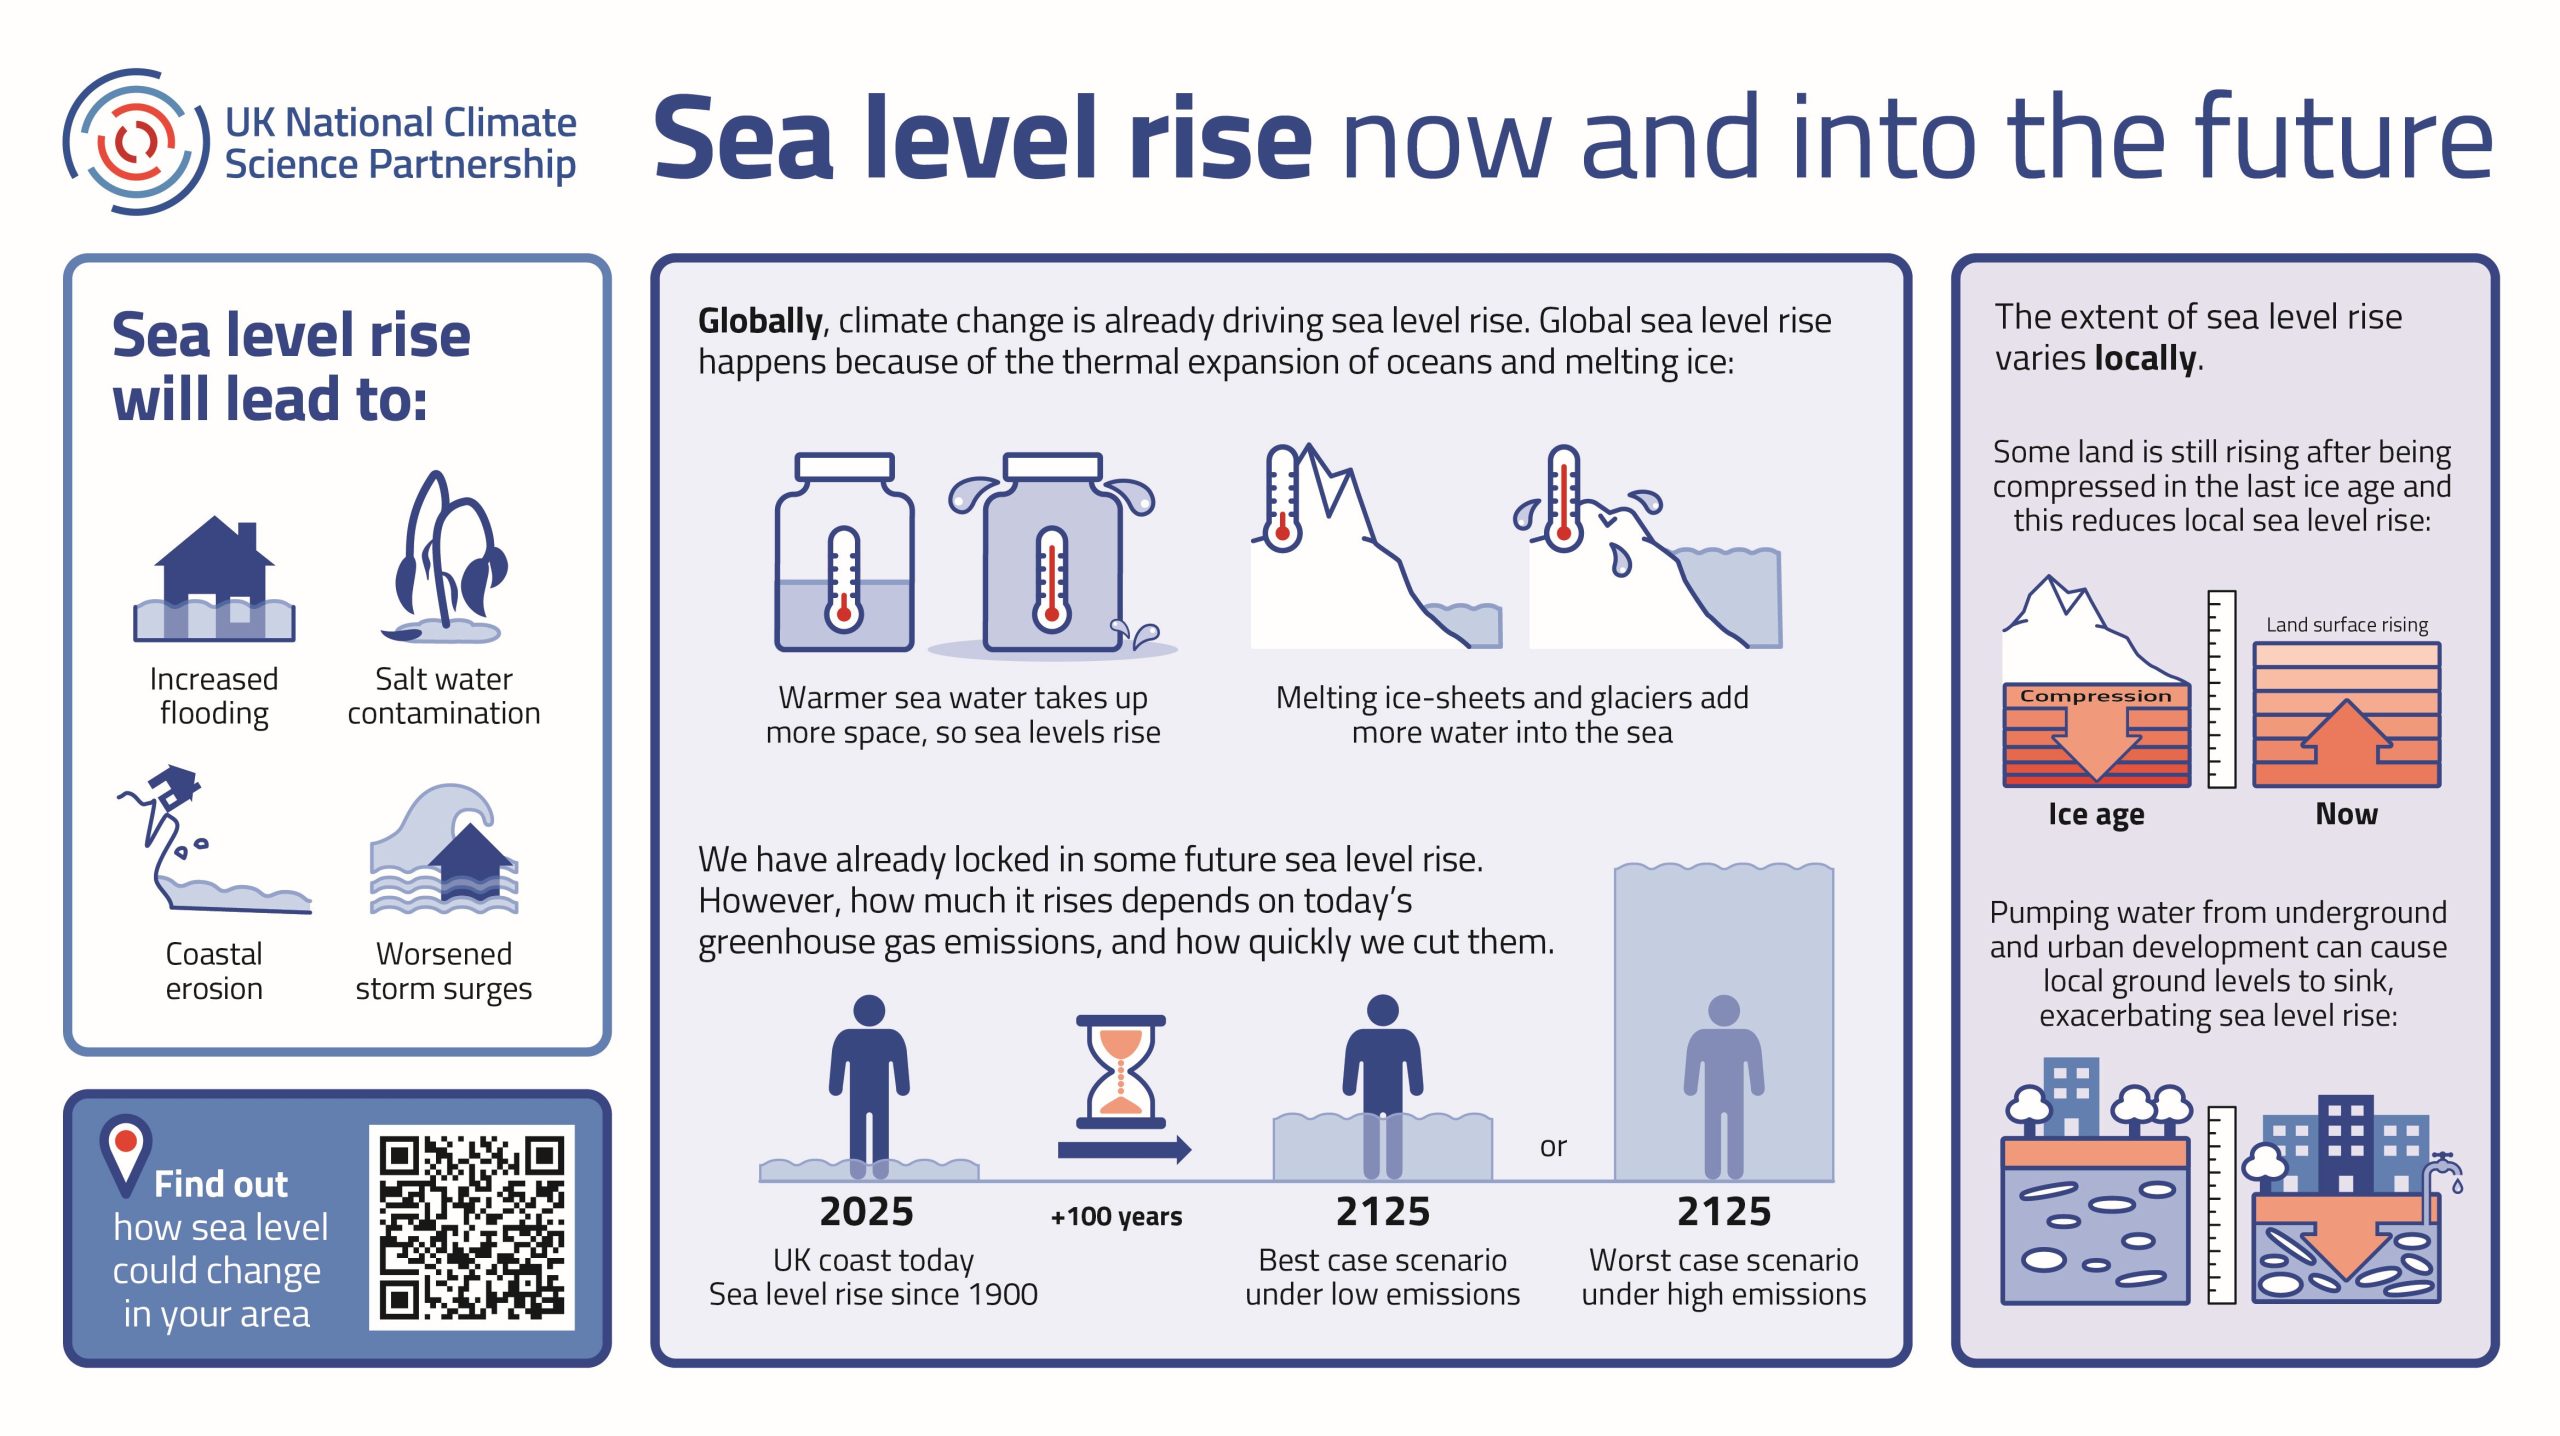
This infographic from the UK National Climate Science Partnership illustrates the causes, local variations, and future projections of sea level rise driven by climate change. Globally, it highlights that rising sea levels are primarily caused by the thermal expansion of warmer seawater and the melting of ice sheets and glaciers. The graphic outlines the major consequences of this rise, including increased flooding, coastal erosion, salt water contamination, and worsened storm surges. While some future sea level rise is already locked in, the visual emphasises that the severity by the year 2125 depends heavily on current greenhouse gas emissions, contrasting a low-emissions “best case” scenario against a high-emissions “worst case.” Finally, it notes that local impacts vary; some areas experience reduced local sea level rise due to land still rebounding from the last ice age, whilst others face exacerbated risks where underground water extraction and urban development cause the ground to sink.
![[Webinar] Sea Level Uncertainties From the Ice Sheets](https://ncasdata.org/app/uploads/sites/19/2025/06/eventbrite-cover.jpg)